
Routes
After selecting a vehicle and a time range, the list of routes can be obtained by clicking on “Query”.
Select the target from the drop-down list directly below the two dates used to specify the time interval (First day, Last day, you can also scroll with the mouse wheel). To display this list, you also need to click on the button indicated by the black triangle pointing downwards. You can only select one target at a time. You can list all of your targets, if you hit 'Enter', while the query box is empty. The system searches all the matching vehicle names, during you are typing into the query area (30 at the same time, scrolling down makes the system load the other vihecles, which were not displayed). The query can be deleted with the red 'X' button.
The route list
2005-2018%20iData%20Kft.%20-%20http:--www.idata.hu_200.png?inst-v=f238aa98-2f40-42b4-9d97-48abc5450071)
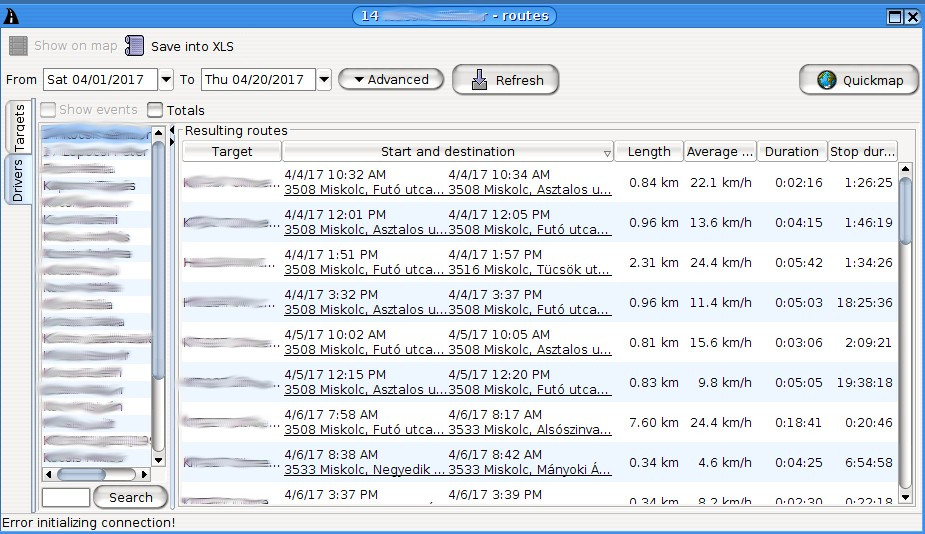
The route list displays the following information:
- Departure and arrival points, dates, and times
- The length of the route taken
- The average speed
- The travel time
- Standby time (time from the last stop to departure)
In some cases, other information may also be displayed, for example, if the route was a company or a private route, etc. Private route sections are not displayed in the list. The program shows the departure and arrival time for the entire private route section and a series of asterisks are shown at the stopping place, even for several days.
You can also select multiple items at once in the route list:
- hold down the left mouse button and drag down or up in the list to highlight items
- click on one of the routes, then hold the SHIFT key down and click on another list item to highlight the elements between them
- click on an item in the list, and then while holding down the Ctrl key, press the letter “A” to select all items in the list
In the bottom of the routes window you can see a summary line of the selected routes.
In addition to the drop-down list for selecting targets, you can activate the “Events” (opening the cargo door, siren on, working, etc.) and the “Summary” as well. Switching on the latter, you can insert daily or full summary lines into the list. Some “Events” may only be shown if such a service has been ordered separately!
When enabling the “Report” option, additional information (the number of fuel stops, the number of tilts, etc.) can be displayed for the selected segments. If there is not a single road section selected, the report shows data for the entire period queried. You can reorder the report columns with a right mouse click on a report column. There is also an option to hide each individual column.
2005-2018%20iData%20Kft.%20-%20http:--www.idata.hu_201.png?inst-v=f238aa98-2f40-42b4-9d97-48abc5450071)
If you queried up to the current date, the “Last known position” (with a yellow background in case of a valid GPS signal, and gray background in the absence of signal) will be displayed, and data will be summarized up to that time in the report, and on the graph when they are selected as well.
The sections of the route list can be displayed in a “standby-based” structure as well. In this case, only the first departure time and the stopping times can be seen. The other departure times can be calculated based on the driving times, standby times and arrival times.
When selecting the “POI addresses” option, you can access the full address of the points of interest. It will also appear in the exported Excel file.
The routes selected from the list can be exported to an Excel file, and you can send it to your customer, or process it etc. The program uses the current settings for the Excel file, for example, if the daily totals are not activated, they will not be visible in the Excel file.
You can click on the “Small map” button at the top right to quickly view the selected routes without opening a new window. The “Small graph” button shows the measured values for the selected route also without opening a new window. The “Quick graph and map” button is combination of the previous two functions. The “Hide quick view” button will close the “Small map” or “Small graph” previously displayed.
Replay on map
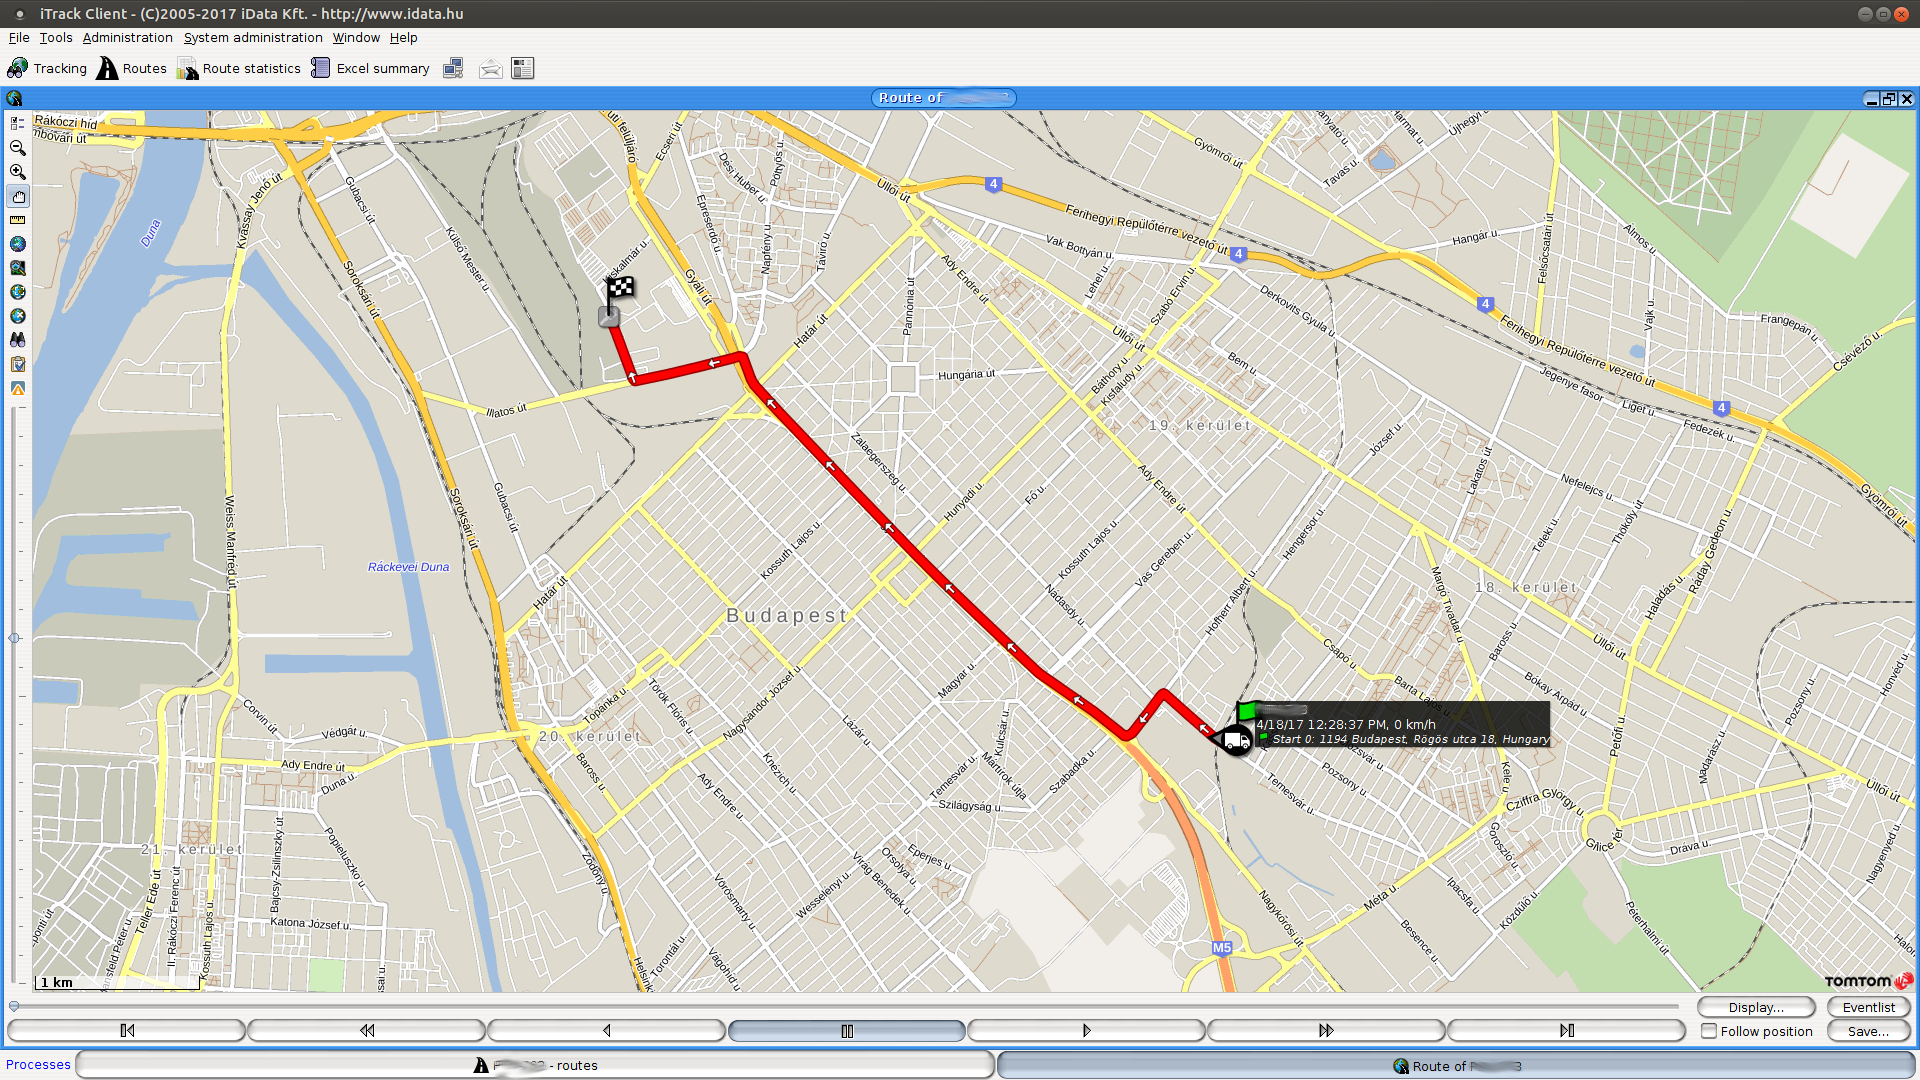
You can investigate more thoroughly the selected routes on the map with the “Replay on map” button.
In this case, the normal map is displayed with the vehicle at the point of departure, and a thick red line shows the route traveled.
Below the map there is a slider, which can be used to move the vehicle from the left end (departure time) along the route traveled. To do this, move the mouse over the small button on the slider, press and hold down the left mouse button and move the mouse in any direction. It is possible to move the vehicle between each of the stored coordinates; to do so, click once on the small button on the slider to select it, and then use the left or right arrows on the keyboard to move the vehicle. There are additional buttons below the slider that can be used like on a video player.
Click on the “Visualization” button next to the slider to select what you want to display on the map: events (different types of events can be filtered), color highlights, ticket tears, the numbering of stops.
When you move the mouse pointer over each event, its details will be visible.
Stopping points along the displayed route can be numbered, so you can track where and in what order the stops occurred during the review of a long route.
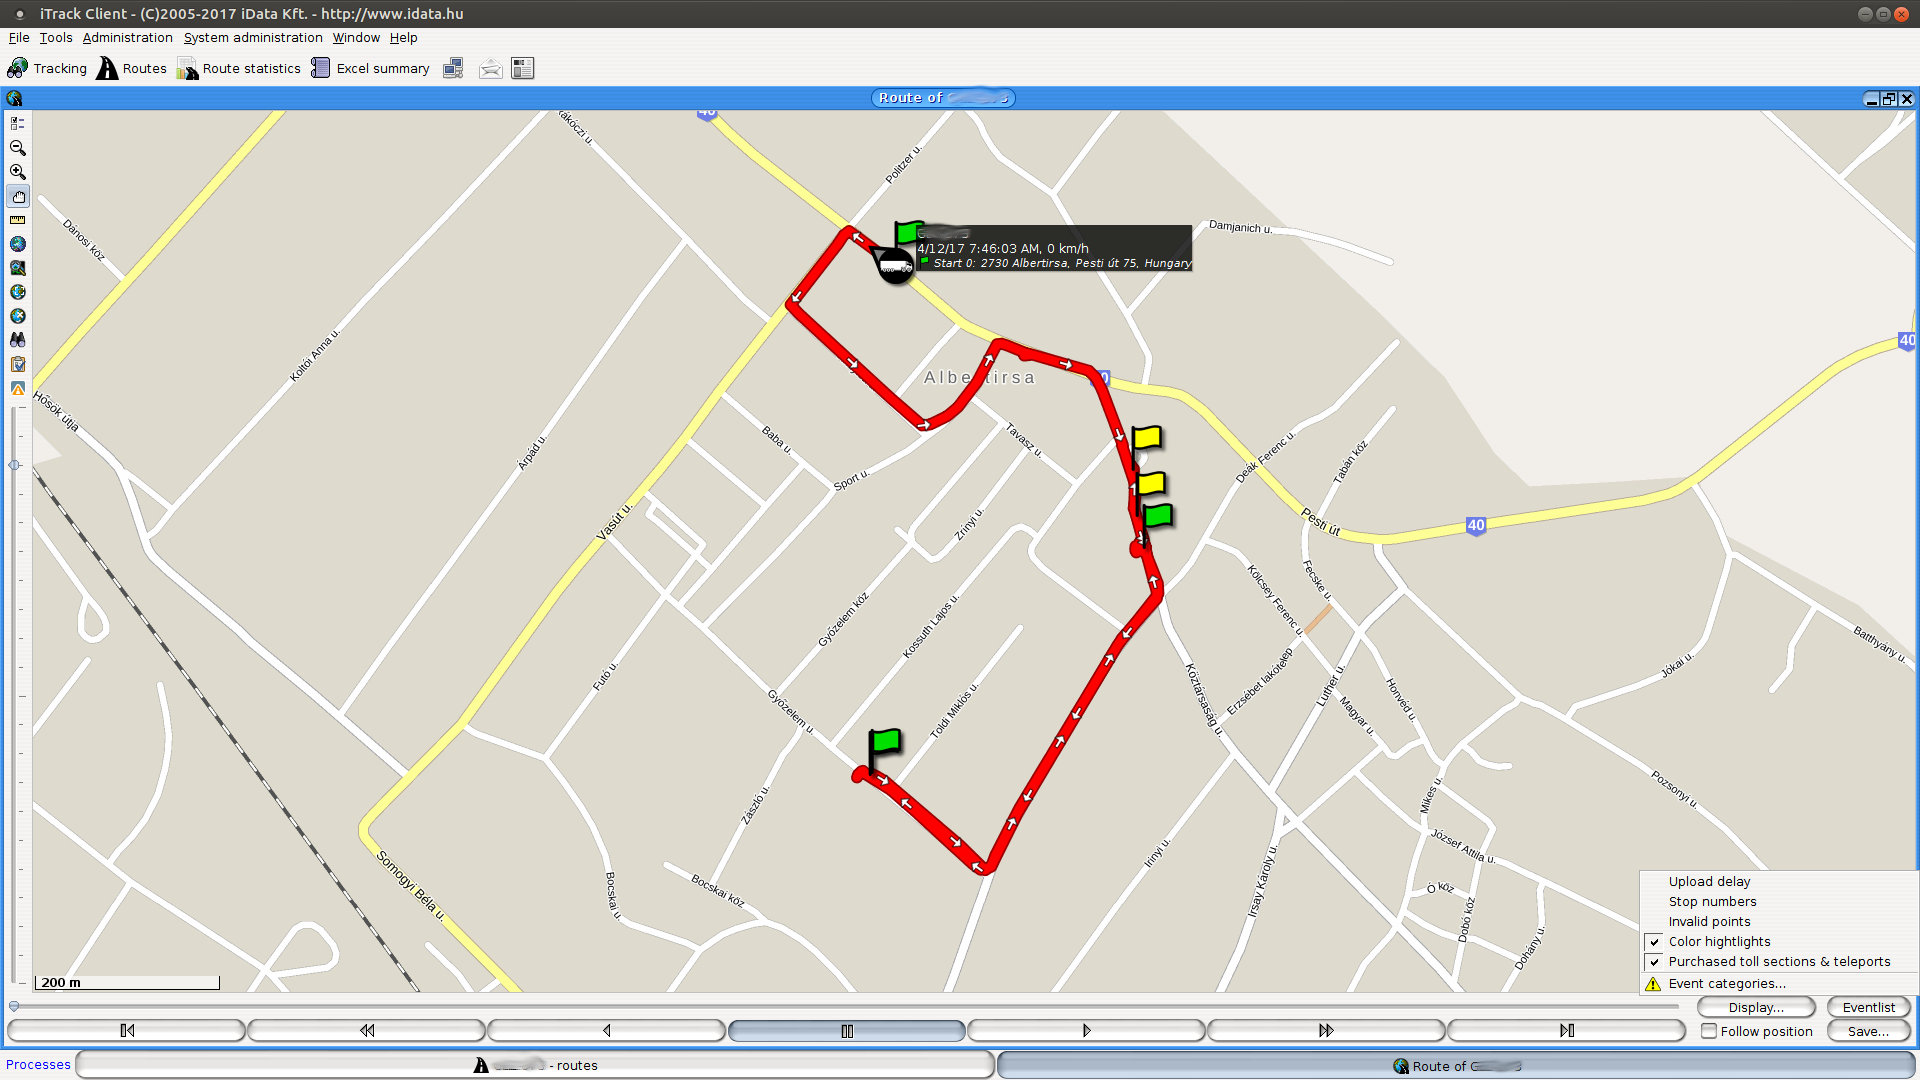
The yellow icons indicate the stops.
Click on the “Events” button next to it to obtain a list of various events; you can also click on these events to make the vehicle immediately jump to where the event occurred.
When you enable the “Track position” option below, the map will follow the moving target.
During replay, the following markers can be seen on the map:
- a green flag at the departure points,
- a yellow flag, which indicates the location of idle waiting, if this feature is turned on,
- a black-and-white checkered flag that indicates the location of the last arrival
- a yellow exclamation triangle, which indicates the location of an event,
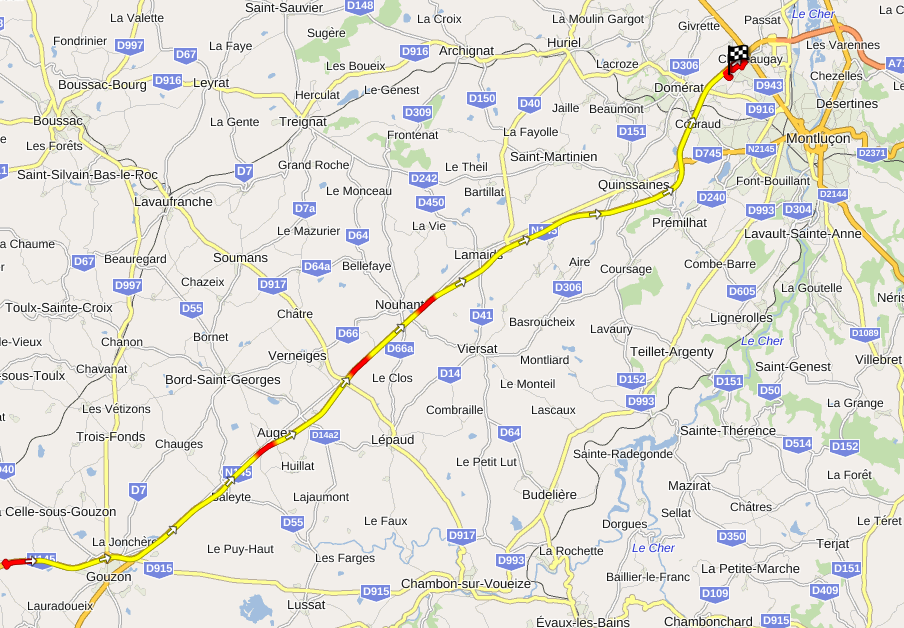
- if a route traveled is indicated with a gray stripe instead of red, it means that the vehicle “jumped” that section, and it may indicate e.g. a problem with satellite reception or power failure in the unit/vehicle, or a private route
furthermore, if the route traveled is displayed with another color (neither red, nor gray) it refers to specific customer situations, such as driving with open cargo door, speeding, etc.
You can save the route shown on the map with the “Save” button to a file with the .sat extension. .sat files can be loaded using the File/Load menu.
Graph
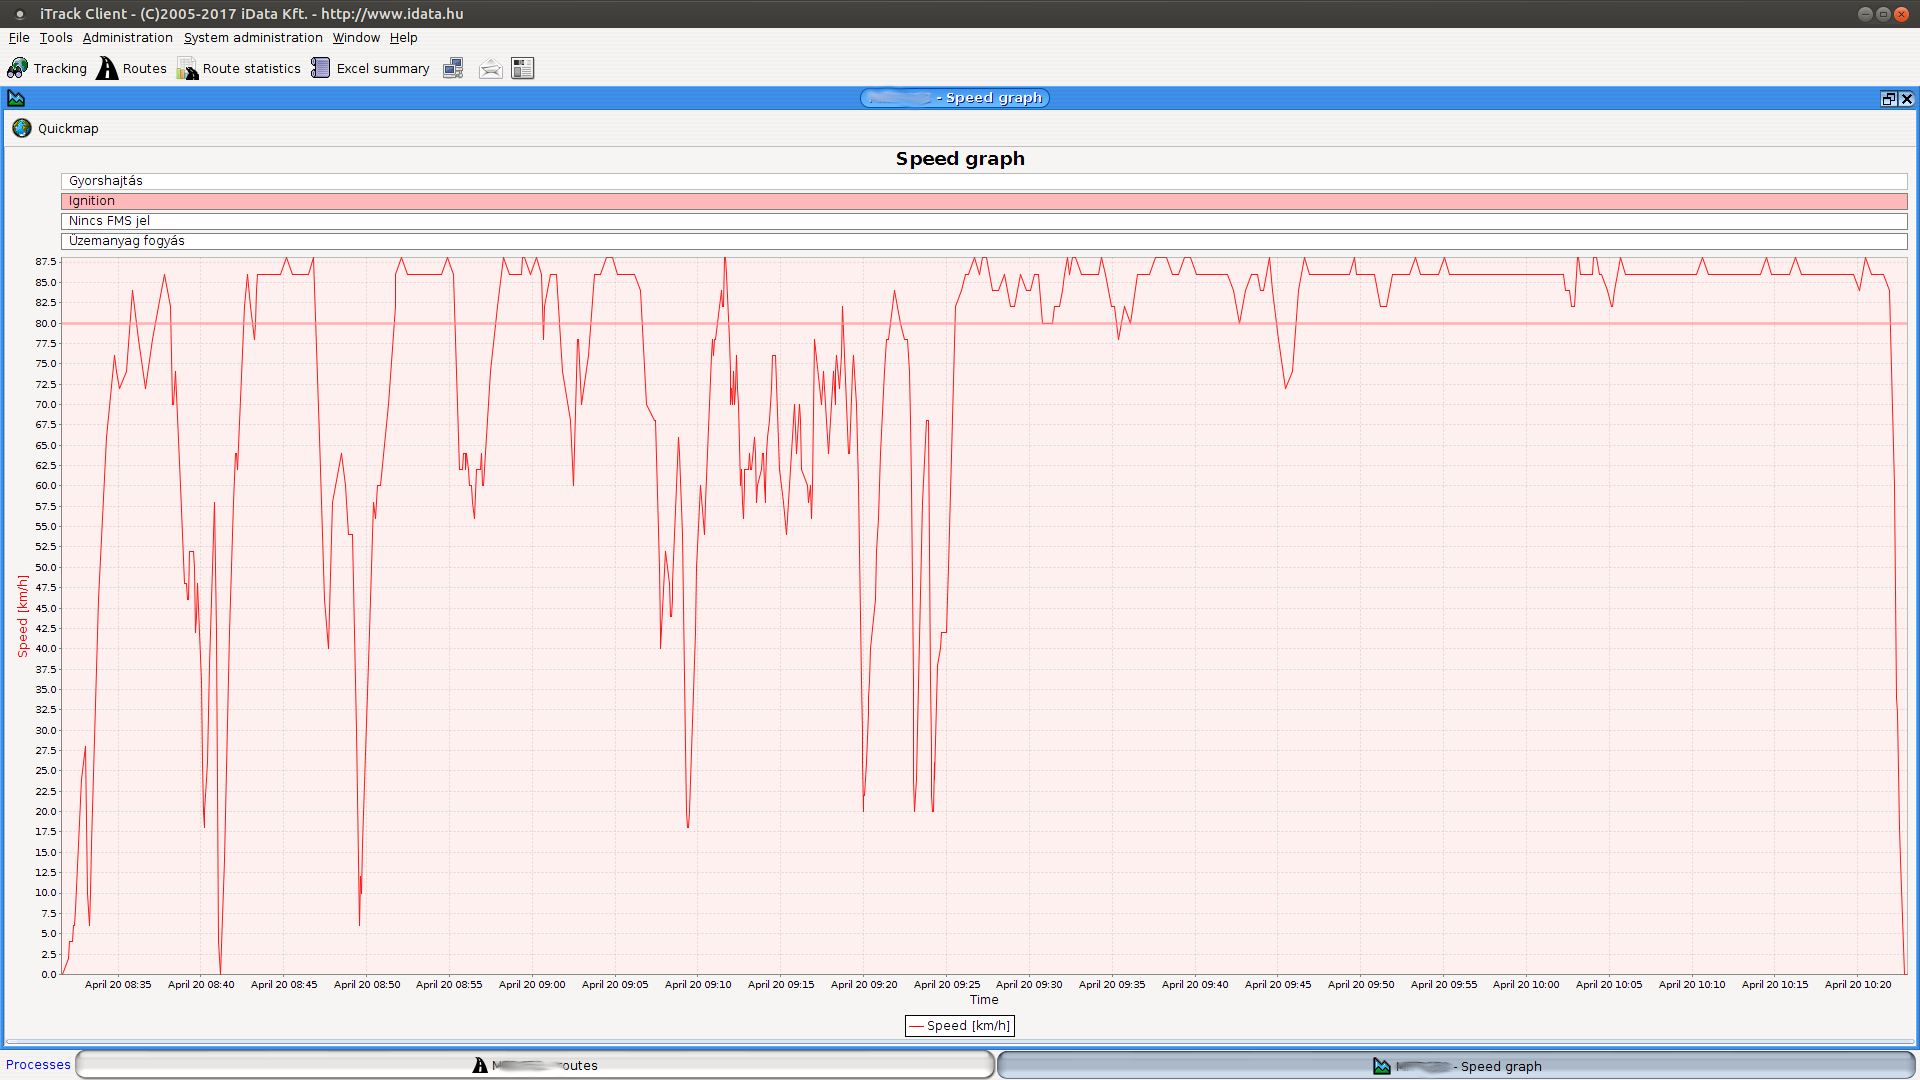
You may display graphs about the selected routes (speed, temperature, etc.). Using the graphs you can see at a glance whether the target or a measured value of it has exceeded any limit or regulation, and you can also verify the correct transportation temperature, control speeding events, etc.
In case of a private route section, measured values are not shown, only the dates of the events.
Click on the graph button to select type of the graph from the drop-down menu. Every graph includes by default the speed graph as a reference in order to help the interpretation of other displayed data.
For more information about graphs, see the help section on Graphs.
Route based on driver
Click on the “Drivers” tab to select the driver you want to create a route list about (list on the left side). Here you can request a daily summary or a summary for the whole period, and also the events can be displayed.
Similar to the target-based route list, these results can be archived as well with the “Save to Excel table” button, and you can display the routes with the buttons “Replay on map” and “Small map”
Detailed data based on the driver can be obtained where you have ordered other means enabling identification (keyboard, RFID) for the installed unit. If you do not yet have such additional units, but you are interested, please contact your reseller or request a quote by e-mail at info@itrack.hu
(C) Copyright iData Kft., 2005-2022. All rights reserved.