
Graphs
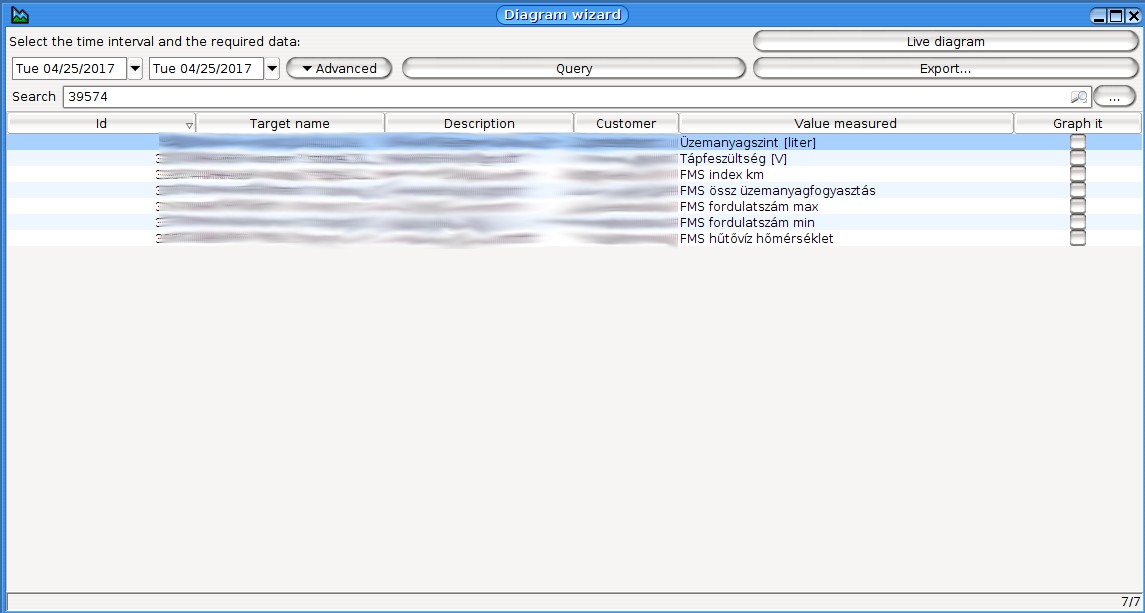
In the window that appears, the list of available channels for vehicle measurement is shown. Click in the box located to the right to select list elements. Any number of measurements can be selected, but it is not recommended to select more than 3 or 4 at a time for more transparency on the graph. You can select time intervals as described in the Help section on „Selecting the date”
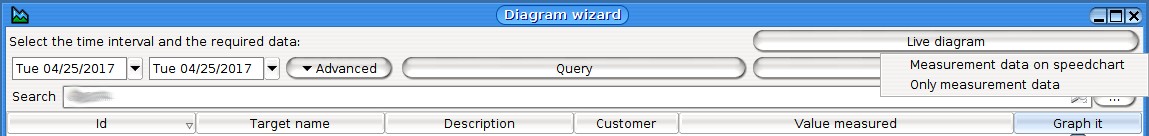
After that, you can click on two buttons; “Query” and “Export”.
In case you want to Export, you can specify a file name and location after processing the data, and then click on the “Save” button to create the exported file.
In case of a Query, a graph is obtained of the selected measurements after processing the data. If you select the data set or data series for querying only for one particular vehicle, then you can choose to see only the data in itself or together with speed data. In case of more than one vehicle, only the measurement results can be compared.
Graph elements
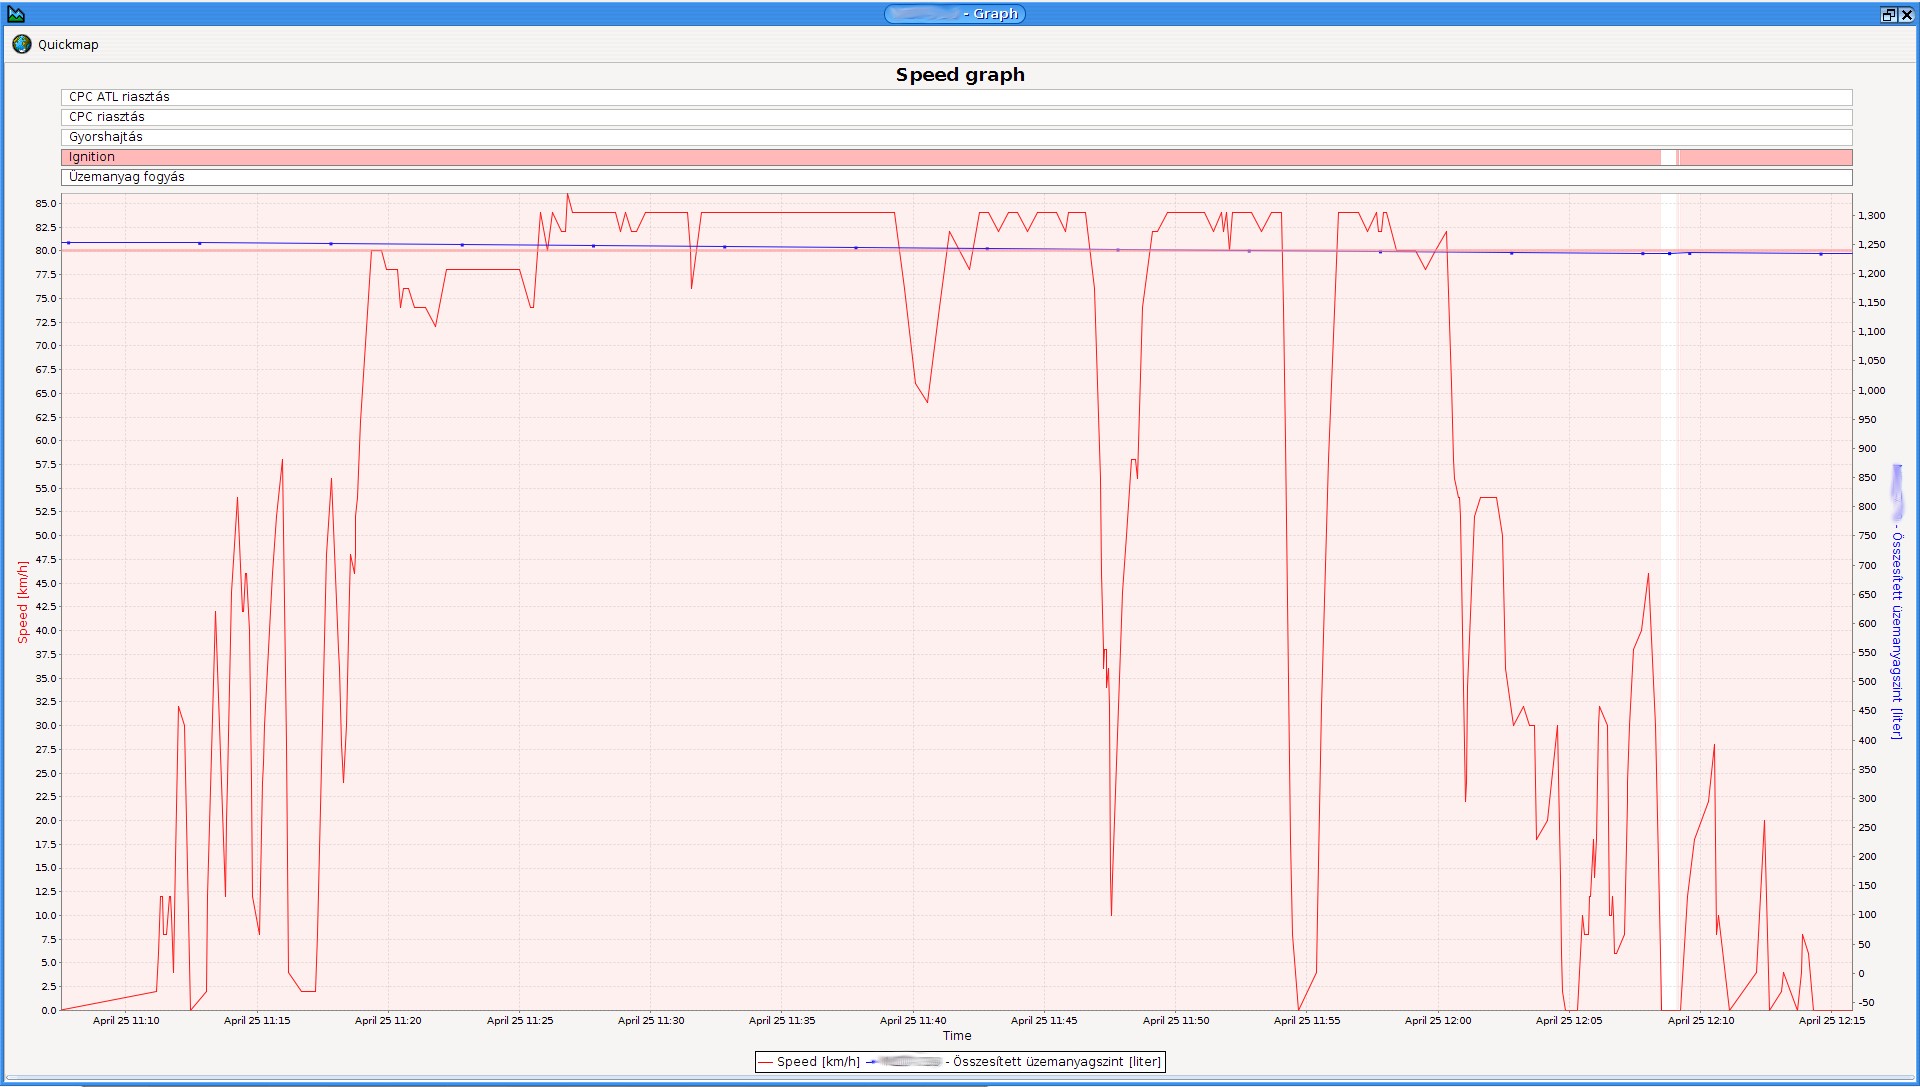
The graph is automatically scaled between the minimum and maximum readings. On the two sides of the graph text labels in different colors identify the measured values and also the scaling level.
At the bottom of the graph, the time scale and a legend are shown.
There are indicator lines above the graph. Of these, only the ignition status indicator is shown most of the time, which colors the graph pale red in the corresponding sections.
If only one vehicle data set (data series) have been queried, the Small Map button appears above the left side of the graph to display the position of the vehicle on the map in the time period in question. In this case, click on a point on the graph to move the vehicle icon to the corresponding location in the route.
Move the mouse over the measurement points on the graph to read the time and the measured data.
In case of a private-company switch, the graph does not show the entire length of the private section, only the ignition status and other events coloring the graph can be seen. In addition, the company section is marked in red on the map during replay, and company segments are connected with a gray line as the crow flies and stop points are not visible during the private time
How to use the graph
The graph view can be enlarged by dragging a “lasso”, i.e., click on a point on the graph, hold down the mouse button and draw a rectangle dragging down (strictly) from the right to define the area you want to see.
If you hold down the Shift key during this operation, the same period will be enlarged, but for the complete value set of the measurement channel.
The graph can be moved left and right when you press and hold the Ctrl key and the left mouse button and drag the mouse left and right. When you reach the end of the processing period the graph will be stretched horizontally. The same result can be achieved with the left and right arrows on the keyboard. The graph can be moved vertically with the up and down arrow keys, and after reaching the lowest or the highest value, the graph will be stretched vertically.
You can also zoom in and zoom out the graph with the mouse wheel relative to the point where the mouse pointer is. However, the scaling value will remain unchanged, so the density and the slope of the curves will change.
After zoom in, you can return to the original view at any time, if you hold the mouse button down and move the mouse to the left or up and then release the mouse button.
It is possible to disable the display of the measurement data shown in the graph (for example speed, fuel, temperature). To do so, click on the text label of the measurement value to be hidden in the legend below the graph (the data label will fade). To show the label again, click on it again.
Live chart
This chart shows the signals coming from the measurement channel live and automatically updates itself when new data arrives.
(C) Copyright iData Kft., 2005-2022. All rights reserved.